
Monitoring
3 phút•25/11/2024
Cài đặt Prometheus + Grafana
Cài Prometheus và Grafana trên Ubuntu, cấu hình nguồn dữ liệu và xem metrics hệ thống; phân biệt vai trò thu thập chỉ số với trực quan hóa dữ liệu.
#grafanaĐọc ngay
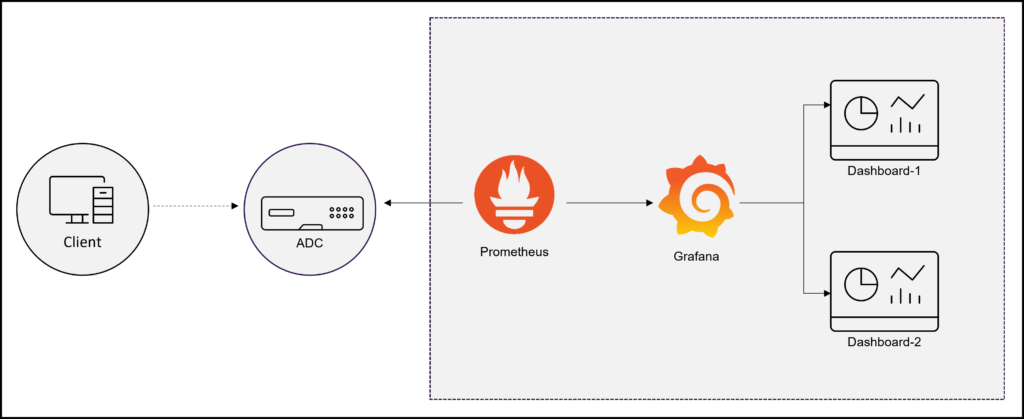
Giám sát VMware bằng Prometheus qua exporter, cấu hình kết nối vCenter và xem chỉ số trên Grafana; phân biệt thu thập metrics với cảnh báo vận hành.
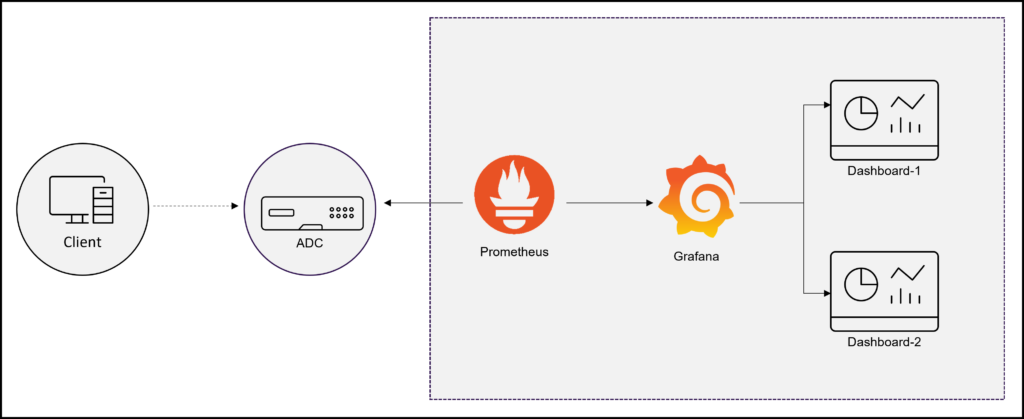
Hạ tầng ảo hóa như VMware đóng vai trò quan trọng trong các hệ thống hiện đại, giúp tối ưu hóa tài nguyên và tăng hiệu quả hoạt động. Tuy nhiên, việc giám sát hiệu suất và tình trạng của VMware là một thách thức lớn. Prometheus, kết hợp với các Exporter chuyên dụng, là giải pháp lý tưởng để theo dõi dữ liệu từ VMware, giúp bạn chủ động quản lý và tối ưu hóa hệ thống. Trong bài viết này, chúng ta sẽ tìm hiểu cách tích hợp Prometheus để giám sát VMware chi tiết nhất.
Cài đặt python3
apt install python3 -y
apt install python3-pip -y
Cài đặt vmware_exporter
pip3 install vmware_exporter
pip3 install --ignore-installed PyYAML
Sau khi cài xong, thư mục chứa source vmware_exporter nằm ở /usr/local/lib/python3.8/dist-packages/vmware_exporter
Tạo file config cho vmware_exporter
nano /usr/local/lib/python3.6/dist-packages/vmware_exporter/config.ymldefault:
vsphere_host: vcenter.yourdomain.com
vsphere_user: 'usermonitor@vcenterdomain.local'
vsphere_password: 'usermonitorpass'
ignore_ssl: True
specs_size: 5000
fetch_custom_attributes: True
fetch_tags: True
fetch_alarms: True
collect_only:
vms: True
vmguests: True
datastores: True
hosts: True
snapshots: TrueTạo file service systemd cho vmware_exporter
nano /etc/systemd/system/vmware_exporter.service[Unit]
Description=Prometheus VMWare Exporter
Wants=network-online.target
After=network-online.target
[Service]
Type=simple
User=root
Group=root
ExecReload=/bin/kill -HUP $MAINPID
ExecStart=/usr/bin/python3 /usr/local/bin/vmware_exporter -c /usr/local/lib/python3.6/dist-packages/vmware_exporter/config.yml
SyslogIdentifier=vmware_exporter
Restart=always
[Install]
WantedBy=multi-user.targetReload daemon và khởi động dịch vụ
systemctl daemon-reload
systemctl enable vmware_exporter.service
systemctl start vmware_exporter.service
Thiết lập Prometheus cho vmware_exporter, thiết lập prometheus gọi tới cổng dịch vụ của vmware_exporter
nano /etc/prometheus/prometheus.yml - job_name: 'dc_vcenter'
scrape_timeout: 1m
scrape_interval: 2m
metrics_path: '/metrics'
static_configs:
- targets:
- 'vcenter.yourdomain.com'
relabel_configs:
- source_labels: [__address__]
target_label: __param_target
- source_labels: [__param_target]
target_label: instance
- target_label: __address__
replacement: thanhnh.id.vn:9272Tiếp theo, bạn tìm trong file prometheus.yml đoạn như dưới và thêm file rule cho vcenter.
rule_files:
  # - "first_rules.yml"
  # - "second_rules.yml"
    - "/etc/prometheus/rules/vcenter.yml"
Thiết lập rule alertmanager cho vmware, tạo một file chứa các rule alert cho vcenter
nano /etc/prometheus/rules/vcenter.ymlBạn copy nội dung giống như dưới vào file (Vcenter.yml đính kèm file)
Bây giờ bạn reload dịch vụ prometheus và dịch vụ alertmanager
systemctl reload prometheus
systemctl reload alertmanager
Import Template JSON Vcenter đính kèm theo file vào , chọn datasource Prometheus -> Done
Prometheus cung cấp một cách tiếp cận hiệu quả và linh hoạt để giám sát VMware, cho phép bạn theo dõi hiệu suất hạ tầng ảo hóa một cách chính xác và đáng tin cậy. Bằng cách sử dụng các Exporter phù hợp và tích hợp Prometheus, bạn có thể đảm bảo hệ thống luôn hoạt động ổn định và đạt hiệu suất cao nhất. Hãy bắt đầu thiết lập ngay hôm nay để tận dụng sức mạnh của Prometheus trong giám sát VMware!
Cài Prometheus và Grafana trên Ubuntu, cấu hình nguồn dữ liệu và xem metrics hệ thống; phân biệt vai trò thu thập chỉ số với trực quan hóa dữ liệu.

Khám phá cách tối ưu hóa hiệu năng của Zabbix trên Ubuntu 22.04+ cho môi trường production.

Khám phá các biện pháp bảo mật và hardening cho Grafana chạy trên Docker để đảm bảo an toàn và hiệu suất tối ưu.

Hướng dẫn chi tiết cách triển khai và cấu hình Prometheus Alertmanager trên Ubuntu 20.04+, giúp quản lý cảnh báo hệ thống thông minh, giảm nhiễu (alert fatigue) và tối ưu hóa quy trình vận hành cho SysAdmin.